
Simple bar chart
Yusuke Igarashi棒グラフを作ってみました。
Datasource部の数字を変えることで、グラフ上の値や表示が変わります。
I made a bar chart with APL.
Try change some parameters in datasource JSON.
DownloadOpen in Editor 19
19 53
53 0
0 3
3
190Share
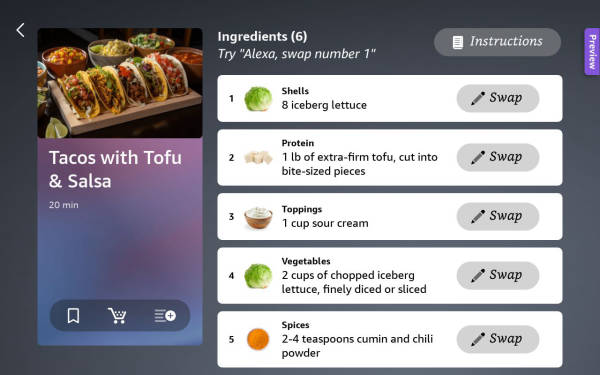
Supported Viewport Profiles
 Hub Landscape, Small
- Hub Landscape, Medium
- Hub Landscape, Large
- TV Fullscreen
Minimum required APL version1.4
Related documents


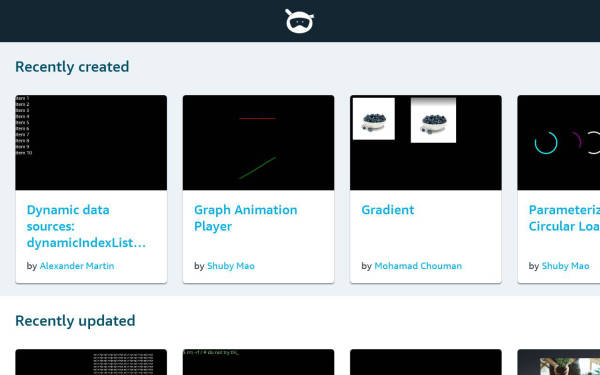

More from Yusuke Igarashi


Comments
Be the first to comment.